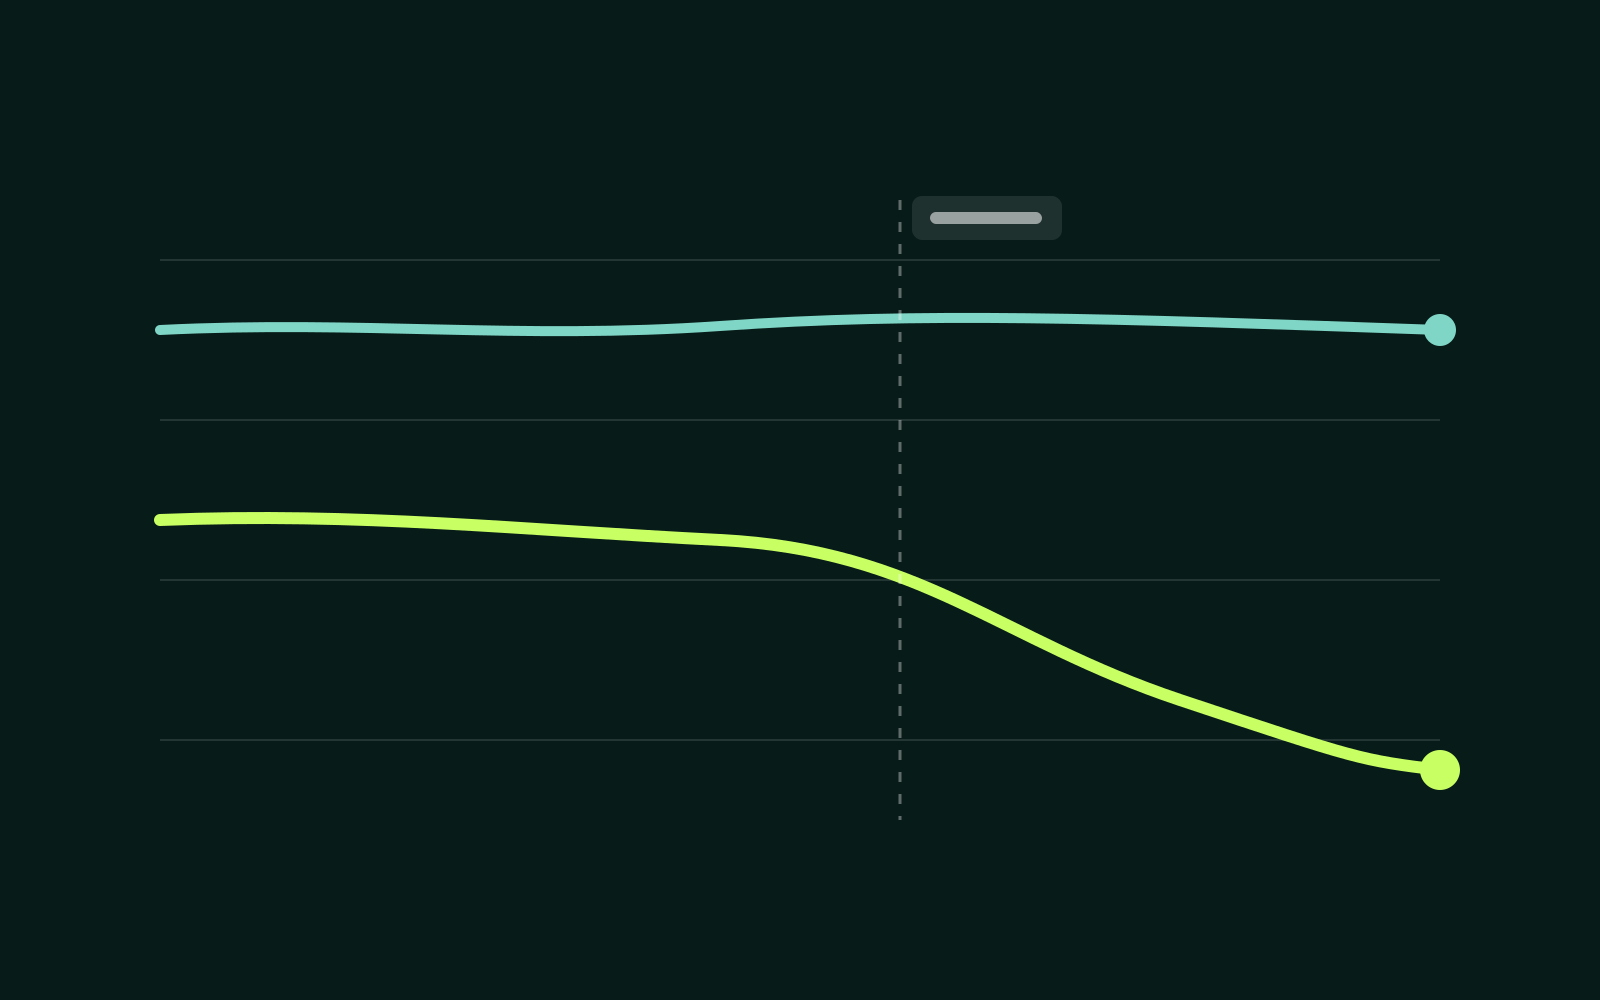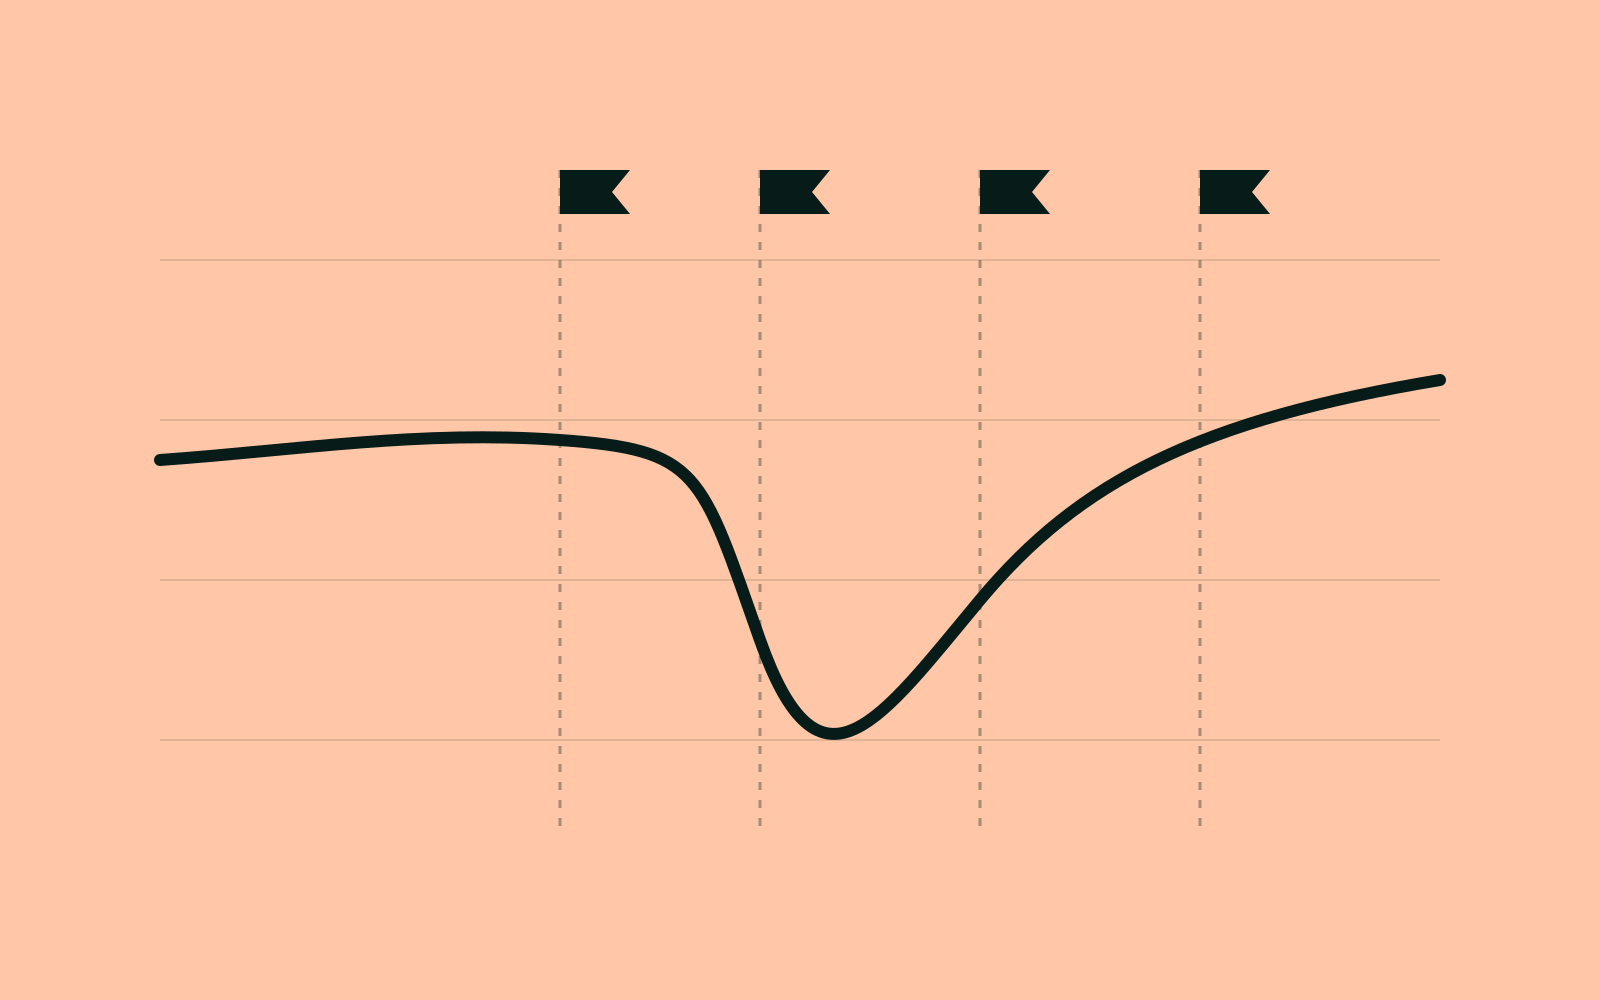
Six months after a migration, someone will ask why traffic dipped in March. If the chart has no annotations, the answer becomes a guess. Annotations turn a line chart into a record of what happened and when.
1. Content freeze
Mark the day content changes stopped. Any movement after this point comes from the migration, not from new pages or edits.
2. Launch day
Record the exact time DNS or the new templates went live, and the share of URLs that changed. A full domain move and a template refresh produce very different dips.
3. Redirect and canonical fixes
Each batch of fixes deserves its own annotation. When recovery speeds up after a fix, you'll be able to prove which change helped.
- List the URL patterns you corrected.
- Note whether the fix was redirects, canonicals or internal links.
4. Recovery check
Four weeks after launch, compare the migrated pages against the same pages a year earlier. Annotate the result, even if it's "not recovered yet". Future you needs to know someone looked.
Annotations live on every chart in the command center.