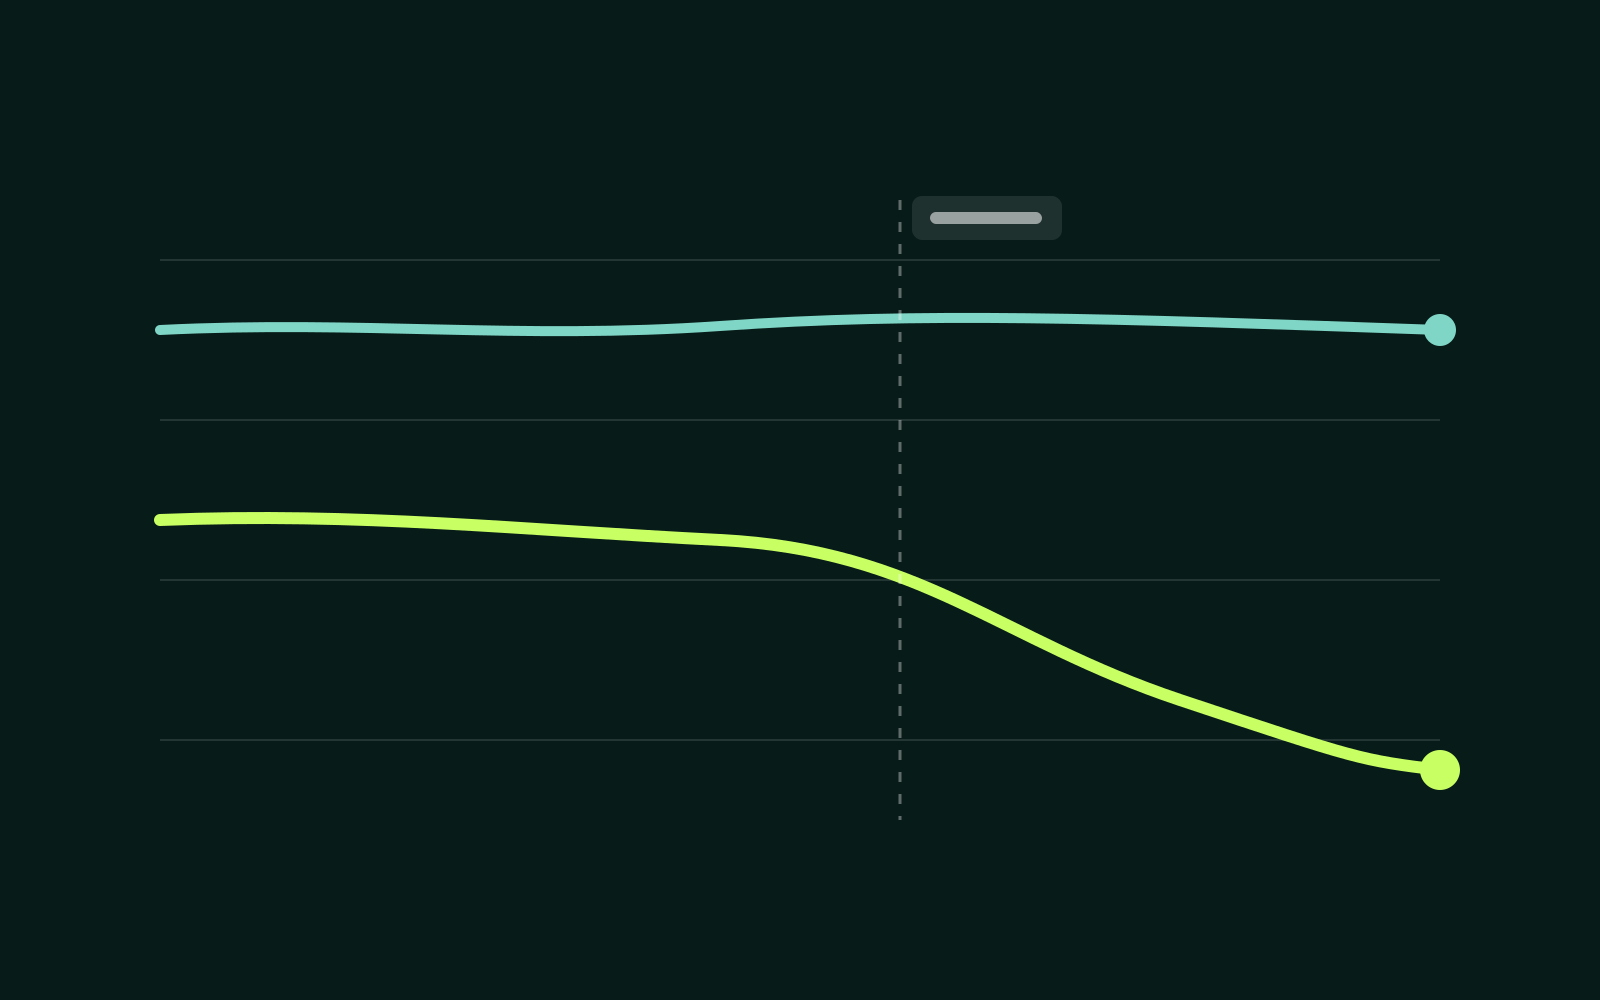
Every few weeks a client forwards the same screenshot: impressions are steady, clicks are down, and the question is always “what did we break?” Most of the time, nothing. But “nothing” isn't an answer you can put in a report. You need evidence.
1. Confirm the shape of the drop
Compare the last 28 days against the same 28 days a year earlier, not the previous period. Seasonality hides in month-over-month comparisons, and a year-on-year baseline removes most of it.
2. Hold position constant
If average position slipped from 2.1 to 3.4, the CTR drop is explained and you're done. If position is flat, CTR dropped at the same rank, which points to the results page, not the page itself.
- Filter to queries where the page ranked in the top 3 in both periods.
- Compare CTR for those queries only.
- If CTR still fell, move on to step three.
3. Check the query mix
A page can gain impressions on broad, low-intent queries while losing them on the narrow ones that actually click. Blended CTR falls even though nothing got worse.
The fastest way to lose a client's trust is to explain a drop with a cause you never checked.
4. Look at the results page
New AI overviews, video carousels or “People also ask” blocks push organic results down without changing reported position. Capture the SERP for your top ten queries and annotate the date the layout changed.
| Signal | Points to | Next step |
|---|---|---|
| Position down | Ranking loss | Content and links review |
| Position flat, mix shifted | Query dilution | Segment by intent |
| Position flat, mix flat | SERP layout | Annotate and test titles |
5. Write the finding, not the feeling
A good finding names the pages, the window, the comparison and the confidence. In QueryDeck, every opportunity card stores exactly that, so the evidence travels with the recommendation.
Try it on your own data: connect a property and open the CTR gap opportunity.